2.3. Health Statistics
This screen uses the tags to classify all your monitors of the network. You can find your custom tags in the ‘Breakup by Tags’ list. To create new custom tags, refer to monitors section.
2.3.1. Breakup by Tags
You can see the count of devices in this list under columns. Each column heading refers to the current status of a monitor.
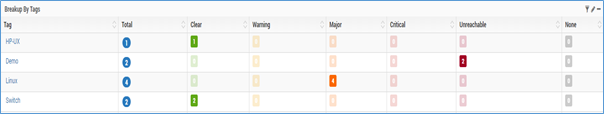
Breakup by Tags
Tag: Shows the name of the tag.
Total: Total number of monitor in the respective tag.
Clear: (Default Severity Color: Green) Number of monitors in clear state. Motadata either pinged the monitors or monitors are in reachable state.
Warning: (Default Severity Color: Yellow) Number of monitors in warning state.
Major: (Default Severity Color: Orange) Number of monitors in major state.
Critical: (Default Severity Color: Red) Number of disabled monitors in critical state.
Unreachable: (Default Severity Color: Magenta) Number of monitors in unreachable state.
None: (Default Severity Color: Black) Number of monitors in the none state (that means no severity is applicable). The monitors in disabled/unknown/maintenance state falls in this category.
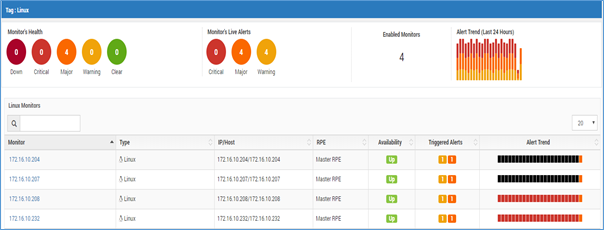
Click on the tag to see following details about it:
Monitor’s Health
Monitor’s Live Alerts
Enabled Monitors
Alert Trend (Last 24 Hours)
Monitors of that particular tag. When you’ll click on the monitor name, Motadata will display following details:
Type
Monitors
IP/Host
RPE
Availability state
Number of triggered alerts
Alert Trend
Use the search option to find a particular monitor from the list.
Details in Tags
2.3.2. Tags
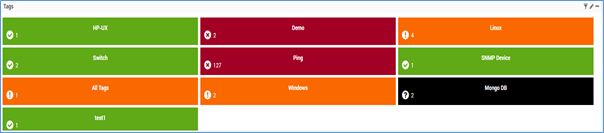
Tags
This widget has listed all the tags along with their health state. If any one of the device goes in to the state other than UP then the color of the tag’s tile will show the highest severity state color across all its devices. For example in Linux tag, there are 8 devices but 4 of them entered critical stage and 4 are in UP stage thus the color of the tile will be red (color of highest severity; here critical) and on the top right corner it will show the count. Click on any tile and you will see:
Name of the monitor included in the respective tag.
IP/Host
Availability
Additional Read: Widet Options